Companion to the poster · Midland, Texas
A quantitative risk assessment of unintended methane release from a storage-tank battery
A fault tree developed with an operator and quantified with screening values and their uncertainty.
Tap a block to jump to that section, or scroll down to begin at Block 1.
- 1Motivation
- 2Framework
- 3Case study
- 4Bow-tie
- 5Fault tree
- 6Quantification
- 7Numbers
- 8Tool
- 9Where it goes
Part of the project A Quantitative Risk Assessment Framework to Predict and Mitigate Large Unintended Methane Emissions in the Natural Gas Supply Chain. The facility and operator are anonymized, and all identifying information is withheld.
Large unintended emissions are episodic and rare. Inventories built on sparse observations miss this fat tail. A malfunction venting at full rate for a day is not an average emission factor, and that is one reason top-down and bottom-up estimates disagree.
So the events have to be estimated probabilistically: how often they start, and how long they last.
Beyond the poster
An unintended release is treated as a state the facility enters and leaves. Three quantities describe it: the fraction of time the state exists (its unavailability, in reliability terms), the frequency of entering it, and the mean duration of an episode.
This is not the quantity a survey reports. A flyover gives prevalence: the share of observations across sites in which emissions were seen. The fault tree gives the share of time one site is expected to spend in the condition. They are not the same quantity, and they do not converge with more surveys. The value here is for ranking failure pathways and weighing mitigation, not for explaining what a survey saw.
Quantitative risk assessment asks three questions of every scenario.
The bow-tie is the diagram that keeps the three answers together: a fault tree on the left, an event tree on the right, the top event in the middle.
Beyond the poster
Fault tree. Deductive. Start from the undesired event and develop its causes downward through AND and OR gates until you reach basic events, causes that are not developed further. Reducing the tree gives the minimal cut sets: the smallest combinations of basic failures that are each sufficient for the top event.
Event tree. Inductive. Start from the top event and branch forward through the mitigative barriers to the end states.
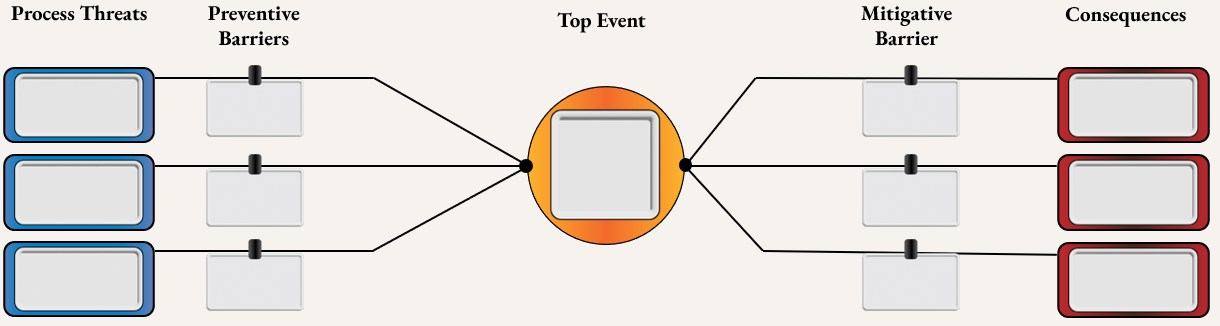
This project builds the left side for one top event and quantifies it. The right side is retained so the top event sits in its full context.
U.S. NRC (1981); NASA (2002); Modarres (2006).
A Permian Basin central tank battery. Eight atmospheric tanks (six oil, two water), a vapor recovery tower, a 10 HP tank-vapor VRU, an air-assist flare and nine separators. Roughly 8 MMSCFD of gas and 1,800 bbl/d of oil.
Wells. The full well stream arrives at the first separators.
Six separators on the production side, in stages. Gas leaves toward sales or flare; oil and water continue down the pressure ladder.
The heater treater, at about 30 psi, finishes the oil and water split. Downstream of it sit the vapor recovery tower and the 10 HP tank-vapor VRU.
Six oil tanks and two water tanks at atmospheric pressure. Trucks load from here. Everything that could not go to sales or flare ends up in these.
Three more separators on the sales-gas side, S-3, S-6 and S-9, route gas to sales and to the HP and LP flares. Nine separators in all, and three VRUs; only the tank-vapor unit is in this analysis. The LP burner needs about 8 oz/in², more than a tank can supply.
The whole battery. The tanks are the low-pressure end of everything, which is why the fault tree starts there.
Process pressure ladder
The second view follows how gas pressure steps down from separation and treatment equipment to vapor recovery and atmospheric storage. The ladder is why compression capacity and relief behavior shape the top event.
Gas steps down from the wellhead: 65, 40, 30 psi through the separators and the heater treater.
Then below one psi in the vapor recovery tower and below half a psi in the tanks. Schematic, not to scale; example readings.
The tanks cannot push their own vapor anywhere. The LP flare burner needs about 8 oz/in², which is the tank design pressure.
Inside the window the vent valve lifts at 5.5 oz/in², the thief hatch at 6, and the VRU only cuts in near 2.2. An open hatch holds the tank below cut-in, and the unit idles while the tank vents.
Beyond the poster
The ladder is why the fault tree in block 5 has the shape it has (see below). The tanks can only hand vapor to a compressor. If that unit is down, is fed more vapor than it is rated for, or cannot receive vapor because the collection line is blocked, tank pressure climbs to the relief set points and the tank vents. The relief devices can also fail on their own, left open after gauging or stuck open by fouling, and then the tank vents whether or not the compressor is running. Those are the two halves of the tree.
The set points are illustrative. The water tanks run a different profile, and all tank vapor goes to flare rather than sales.
Two threats are developed into the fault tree: the relief path losing containment, and the tank VRU system failing. Their preventive barriers are drawn beside them.
Four more threats are shown with their barriers and stay at this level: truck hauling, tank cleaning and maintenance, shell or roof failure, lightning and freeze.
The top event: unintended methane release from the storage-tank battery to atmosphere. This is what the left side is quantified against.
To the right, the mitigative barriers and the consequence as drawn: continuous detection, operator intervention, and a large release to atmosphere.
The whole bow-tie. This project builds and quantifies the left half.
Top event: unintended methane release from the storage-tank battery to atmosphere.
Beyond the poster
Six threats are drawn. Two of them, relief-path loss of containment and VRU system failure, are developed into the fault tree and quantified. The other four (improper truck hauling, tank cleaning and maintenance, shell or roof failure, lightning and freeze) are shown with their barriers and stay at this level.
The structure was reviewed with the operator. That review confirmed the VRU sizing, reclassified VRT-down and new-well flush production as gross exceedance of the unit, and identified paraffin with rust scale as the manifold fouling mechanism.
One drawing, read from the top down. Scroll, or jump to a stop. The physical boundary is the tanks; the analytical boundary reaches upstream to whatever can manifest itself at the tanks, which is why a dump valve and a bypassed separator sit in this tree.
TopRoutesABB1ConditionRepairRestartB3All
One top event: unintended vapor release from the storage-tank battery to atmosphere.
Two routes under an OR gate. Either is sufficient on its own.
Route A, the relief path. A thief hatch or vent valve fails to contain vapor: left open after gauging, stuck by fouling, fails to reseat. No VRU failure is needed.
Route B, vapor-handling failure. Three ways: the unit is unavailable, the unit is overwhelmed, or the vapor cannot reach it.
B1, collection path blocked. Freeze or hydrate, paraffin or scale, or an isolation valve left closed. The paraffin and rust-scale mechanism was identified during operator review. Vapor is generated but cannot travel to a healthy, waiting unit.
B2 is organized by what ends the outage. Condition-limited: power loss, elevated header pressure, freeze in the line. Back when the condition clears. Standing states; the single largest cut set sits here.
Repair-limited: down until someone fixes it. Five families of failure.
Compressor mechanical, lubrication, and high discharge temperature: bearings, seals, motor, gearbox; oil pump, filter, low oil level; cooler, thermostat, a stuck discharge check valve.
Suction faults and controls: scrubber high liquid level, a blocked suction line, PLC or firmware, a sensor or transmitter, an actuated valve.
Restart-contingent: a transient trip and an auto-restart that fails on demand. Short, and only counted when both happen.
B3, recovery overloaded, is a race between load and capacity. Two ways to lose it.
Marginal exceedance: an elevated vapor load, from gradual generation increase, well slugs, or off-spec separation, meets a unit whose capacity is already reduced by partial suction restriction, compressor wear, or elevated header pressure.
Large exceedance beats the rating outright: separators bypassed, VRT bypassed or down, gas blow-by through a dump line, flush production from new tie-ins. This is the case for oversizing the VRU.
The whole map. The full-screen button opens it for pan and zoom.
Each basic event carries an ID, a parameter form matched to how it behaves, an evidence source, and an uncertainty. Monte Carlo propagates the uncertainty to the top event.
Three parameter forms
Failure rate with repair rate for running equipment that fails and gets fixed. Frequency with duration for standing conditions that come and go. Probability of failure on demand for devices that are asked to act, such as an auto-restart.
The three descriptors of a state are tied together. With frequency w per year and mean duration d in hours, the unavailability is q ≈ w·d/8760. Every gate in the tree reports all three.
A sample from the appendix
| ID | Basic event | Parameter | Evidence | Uncertainty |
|---|---|---|---|---|
| SPL | Site power loss | f = 5.7×10⁻⁴ h⁻¹, d = 12 h | Assumption: about 5 a year, 12 h each | lognormal, EF 6 |
| EDP | Elevated flare-header pressure | f = 0.003 h⁻¹, d = 24 h | operator elicitation | lognormal, EF 3 |
| INSTX | Momentary process excursion | f = 0.0014 h⁻¹, d = 6 h | Assumption: about monthly, 6 h | lognormal, EF 6 |
| AR-F | Auto-restart fails on demand | p = 0.0044 | OREDA, p. 95 footnote | lognormal, EF 4 |
| RP-01 | Thief hatch left open after gauging | f = 0.001 h⁻¹, d = 12 h | operator elicitation; one shift assumed | gamma, α 3.5, β 4.38×10⁴ |
Where the numbers come from
Three kinds of evidence are used: generic reliability data (OREDA), operator elicitation, and stated assumptions. Qualitative operator input was mapped to pre-declared frequency bands. Assumptions are labeled in the table.
An error factor of 3 means the 95th percentile of a lognormal sits three times above its median. The intervals in block 7 cover parameter uncertainty only. They do not cover the tree structure, mechanisms left out, or dependence between events that the model does not represent.
Rank the five largest minimal cut sets by their share of top-event unavailability, and standing conditions lead: elevated header pressure, the VRT down.
Rank the same five by their share of top-event frequency, and the shorter states climb: the open hatch, the power loss.
Same tree, same parameters. Only the measure changed. For a given unavailability, the shorter the state the more often it is entered, so duration alone decides who moves.
Unavailability answers how much of the time; frequency answers how often. A long-lived condition can rank first on one and fifth on the other. The ranking is where mitigation is weighed: what to add or change to move the top entries down, and what that costs.
Screening level: generic data and operator elicitation, no site failure records. The structure is the claim; the numbers are placeholders.
Beyond the poster
By branch, deterministic
- Top event0.160unavailability47per year29.8mean h
- Route A, relief-path failure0.0122unavailability9per year12.2mean h
- Route B, vapor-handling failure0.150unavailability40per year32.8mean h
- B2, VRU unavailable0.0928unavailability33per year24.7mean h
- B3, recovery overloaded0.0594unavailability9per year57.4mean h
- B1, collection path blocked0.00681unavailability2per year20.0mean h
Under the screening parameters the top-event condition exists about 16 percent of the time, arises roughly every eight days, and lasts a mean of about 30 hours. Route B carries it: 12 times Route A in unavailability, 4.6 times in frequency, with episodes about 2.6 times longer. These describe the condition, not what it emits. A high unavailability does not imply that large releases occur at the same rate; release magnitude is outside this analysis.
Minimal cut sets by unavailability
All ten are single events; no combination of two or more makes the list. The top-event number is the least informative output. The list is where the information is, and ranked by unavailability it is headed by standing conditions, states that hold for long stretches of time. The percentage is each cut set's share of the total.
The same cut sets by frequency
The shorter states move up the list and the longer ones move down. Same tree, same numbers. The only thing that changed is what was ranked: how often the state occurs, instead of how much of the time it exists.
Uncertainty
- Top-event unavailabilityP5 0.114median 0.190P95 0.314
- Top-event frequency, per yearP5 30.0median 50.6P95 88.4
- Mean duration, hoursP5 26.0median 32.1P95 43.2
Bar spans P5 to P95; the tick is the median, the hollow tick the deterministic point value. Means: 0.199, 53.8 per year, 33.0 hours.


Build by clicking. Failure models matched to how components behave. Every value carries its uncertainty as an error factor or a fitted distribution, and Monte Carlo propagates it. Outputs: minimal cut sets, top-event unavailability and frequency, importance measures, mean duration. The case-study tree loads as the starting example: delete a branch that does not apply to your site, change a number you have better evidence for, recalculate. That is the what-if the tool exists for.
Why a tool
Fault trees are tedious, shifting and often data-poor. Construction is a back-and-forth with the people who run the site, and the tree changes as operations change and as different experts weigh in. Quantifying it adds work of its own: the tree must be reduced so the important pathways are visible and the top event is neither over- nor under-counted, and the numbers it needs are often generic, missing, or uncertain.
The tool makes the back-and-forth cheap. Gates and events are placed and connected on a canvas; each event is given one of the failure models above; each number keeps its source and its uncertainty next to it. Quantification is exact (binary decision diagrams) with the cut sets listed alongside, and the Monte Carlo runs over the same tree with correlation between parameters that share a source. Trees can be imported and exported.
What this is: a failure map for one top event at one kind of facility, developed with an operator, quantified with screening values and uncertainty, and decomposed to the states and entries that carry it.
What it is for: a first, screening-level answer to how often the top-event condition arises at a battery of this kind and how long it persists, and a ranking of the failure pathways that carry it, and a place to ask what changes the answer: a larger VRU, a second unit, a different set point.
An iterative map
The tree is a working document. Each review with the operator can refine the structure, so a mechanism may be added, a branch reclassified, or a set point revised. Additional case-study inputs can replace assumptions or generic rates and tighten uncertainty bands. How far the structure carries to other batteries remains open.
A failure map for one top event at one kind of facility: developed with an operator, quantified with screening values and their uncertainty, and decomposed to the states and entries that carry it.
Rev 1 · September 2026. Under consideration for Rev 2: persistent high tank level as a large-exceedance pathway, from the review.
References
- Allen, D.T. et al. Multiscale measurement and modeling of methane emissions in U.S. oil and gas production regions.
- Vesely, W.E., Goldberg, F.F., Roberts, N.H., and Haasl, D.F. (1981). Fault Tree Handbook. NUREG-0492. U.S. Nuclear Regulatory Commission, Washington, DC.
- National Aeronautics and Space Administration (2002). Fault Tree Handbook with Aerospace Applications, Version 1.1. Office of Safety and Mission Assurance, NASA Headquarters, Washington, DC.
- Modarres, M. (2006). Risk Analysis in Engineering: Techniques, Tools, and Trends. CRC Press.
- OREDA (2002). Offshore Reliability Data Handbook, 4th ed.